 VitaLinks
Guide › Your records and progress
Your records and progress
Blood pressure, medication, weight and body composition, each with its own history. And the charts to see, at your own pace, how you’re doing.
1. Blood pressure and pulse
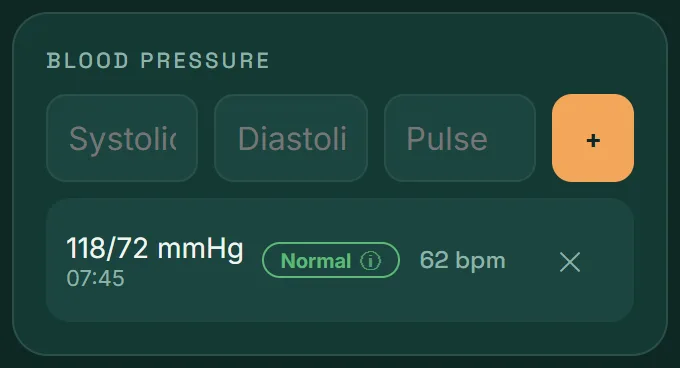
- Open the Health tab.
- Type the values from your monitor into Systolic and Diastolic. Pulse is optional.
- Tap +.
Each reading is saved with its time and a category label (Normal, Elevated, Hypertension stage 1 or 2). Tap the label to see which range belongs to each, based on American Heart Association guidelines.
It’s information, not a diagnosis. The categories are a guide. If a reading worries you, talk to a healthcare professional.
2. Medications
First you set the medication up; after that, each day you only mark the doses.
- In Health, scroll down to Manage medications.
- Enter the Name, the Dose and the times separated by commas: “08:00, 20:00”.
- Tap + Add.
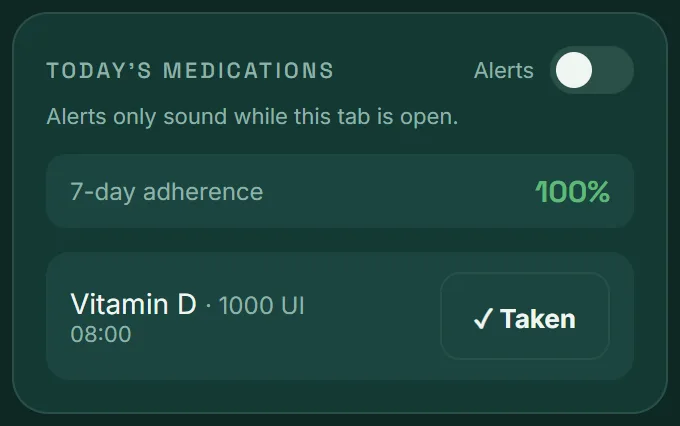
- Each day, under Today’s medications, tap Mark taken when you take it.
7-day adherence shows what percentage of the scheduled doses you’ve marked this week.
About alerts. The Alerts switch notifies you when a dose is due, but it only sounds while you have the Health tab open. It doesn’t replace your phone’s alarm.
3. Weight and body composition
Weight and sleep are logged on the Today screen. If you have a smart scale, the Body Comp tab stores the rest of what it tells you.
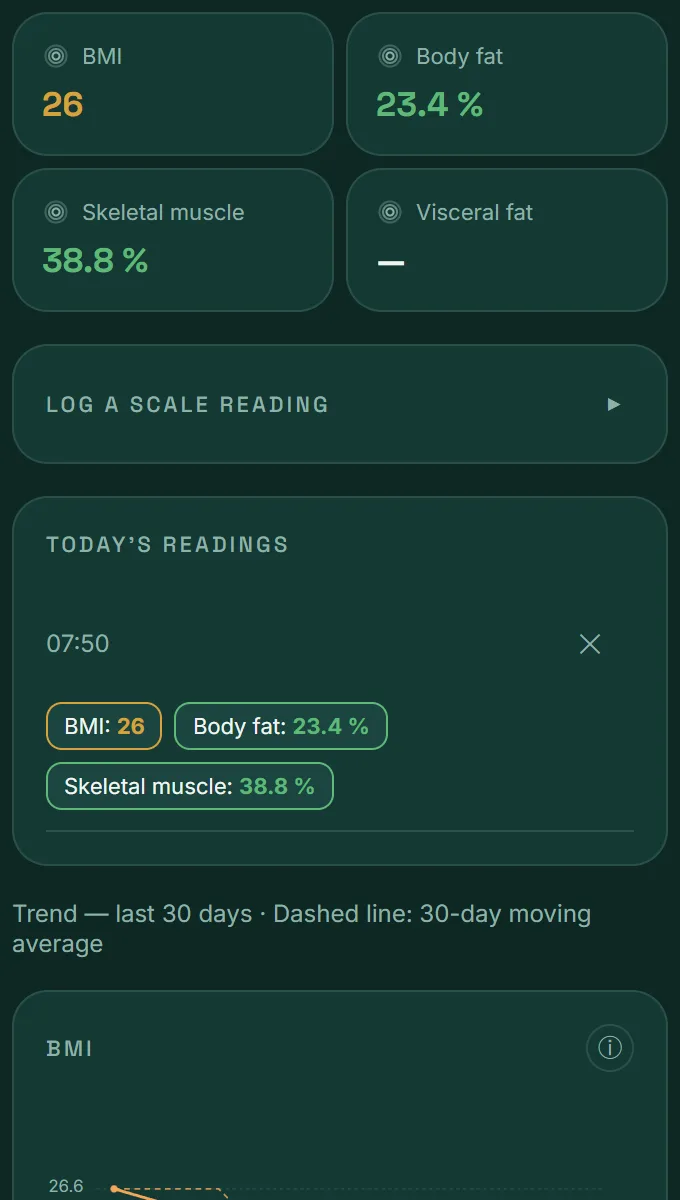
- Open Body Comp and tap Log a scale reading.
- Fill in only the values your scale shows: BMI, body fat, skeletal muscle, visceral fat, basal metabolism…
- Tap + Add reading.
Below you’ll see the trend for the last 30 days. The ⓘ icon on each chart explains what that metric means.
4. The calendar
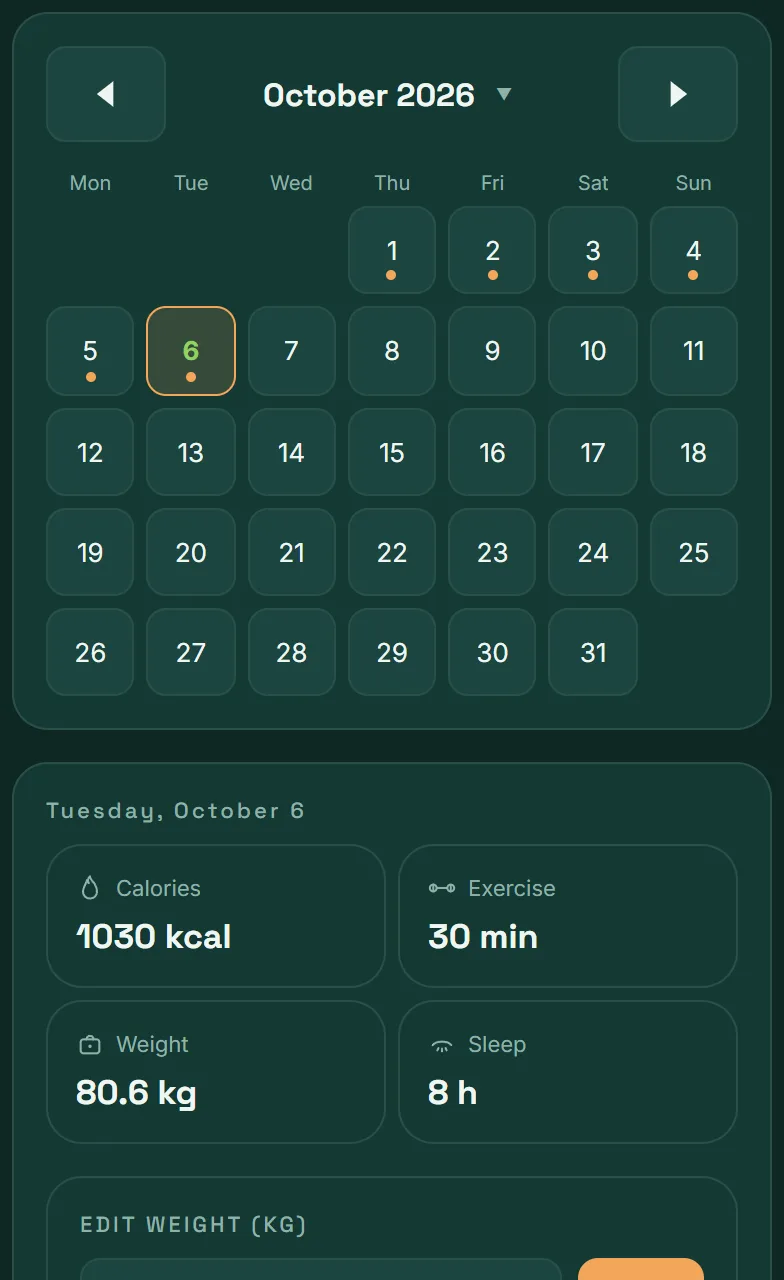
Calendar is your day-by-day history. A dot under the number means that day has entries.
- See a day: tap it. Its calories, exercise, weight, sleep, meals, blood pressure and medications appear below.
- Fill in or correct: from that same detail you can add meals and exercise, and change weight or sleep.
- Change month: use the arrows at the sides.
5. The Progress charts
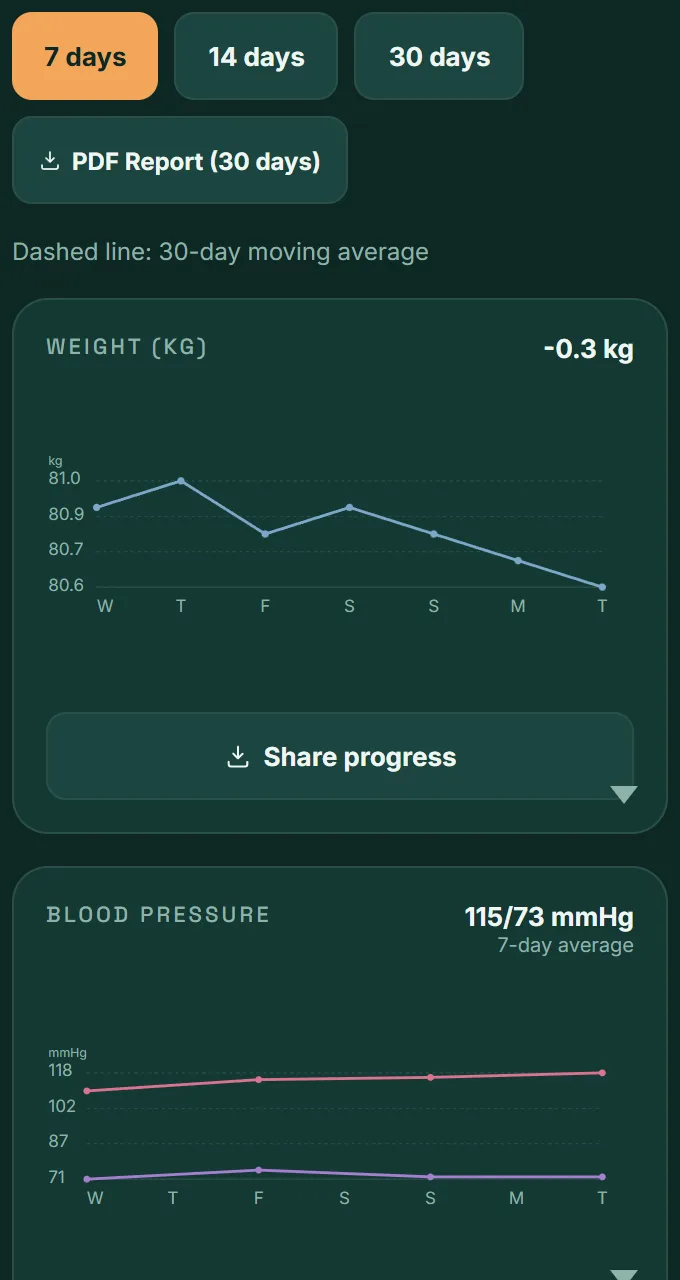
Progress brings your trends together: weight, blood pressure, pulse, calories, exercise, water and sleep. If you’ve connected your phone or watch, steps, heart rate and oxygen saturation too.
- Period: choose 7 days, 14 days or 30 days.
- Dashed line: the 30-day moving average. It smooths out daily ups and downs so you can see the underlying trend.
- Enlarge: tap a chart to see it bigger.
Sharing and taking it to your doctor
- Share progress creates an image of your weight trend. It needs at least two logged weights.
- PDF Report (30 days) downloads a report with your summary, readings and daily log, made to show your doctor.
6. Patterns, Nutrition and Forecast
- Patterns (at the bottom of Progress): looks for relationships in your own data from the last 60 days, for example between your sleep hours and your blood pressure. It needs at least two weeks of entries.
- Nutrition: how your macronutrients and micronutrients have gone over the last 30 days.
- Forecast: an estimate of how long it will take to reach your target weight. It asks for your height and target weight, and at least four days of logged weight in recent weeks.
They’re calculations on your data. Patterns and the forecast are statistics and estimates, not medical advice.
Frequently asked questions
Does VitaLinks replace my doctor?
No. It’s a personal tracking tool: it helps you keep your data and show it to your doctor, but it doesn’t diagnose or recommend treatment.
Can I get medication reminders with the app closed?
Not for now. Medication alerts only sound with the Health tab open. So you don’t miss a dose, use your phone’s alarm as well.
I typed a blood pressure reading wrong
Delete it with the ✕ next to it and enter it again.
The forecast isn’t showing
It needs your height and target weight in the Forecast tab, and at least four days with a logged weight in recent weeks.